2020, 2021, and 2022 greenhouse gas inventory data
Operational data summary
Mozilla first calculated and reported our greenhouse gas (GHG) inventory in 2020, reflecting our 2019 data. Today we continue this approach of accountability and transparency regarding our environmental impact by reporting our latest inventory data, reflecting 2020, 2021, and 2022, which closes the gap since our last report and bridges our reporting activities to the present day.
For calendar years 2020, 2021 and 2022 (i.e. January 2020 - December 2022), Mozilla's total operational emissions (including scope 1, 2, and 3) were 36,235 metric tons of carbon dioxide equivalent (tCO₂e), before carbon offsets or removals. Mozilla’s total GHG emissions for 2022 were 15,281 tCO2e.
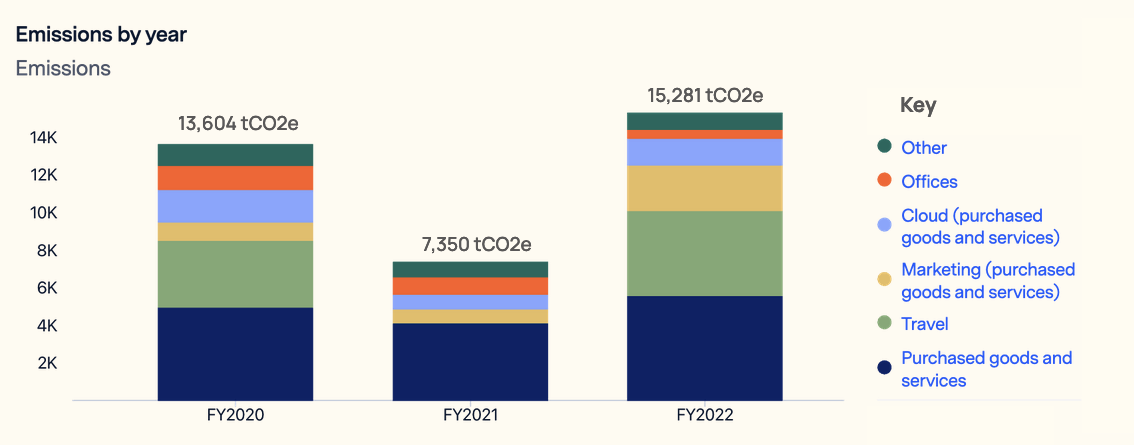
Mozilla’s total GHG emissions for 2022 were 15,281 tCO2e
In accordance with The Greenhouse Gas Protocol, scope 1 emissions are direct emissions from company-owned or controlled sources, such as natural gas used to heat offices. Scope 2 emissions are indirect emissions associated with the electricity a company uses to power its operations, such as electricity used in offices. Finally, scope 3 accounts for other indirect emissions both upstream and downstream that are not directly owned or controlled by the company, but occur as a result of business operations. Examples include emissions from business travel, employee commuting, and purchased goods and services.
This latest greenhouse gas inventory data provides critical insights for Mozilla, serving as a key input into the foundations of our Sustainability Program strategy. These results help us understand the sources of our emissions, start to identify possible ways to reduce them, and monitor our progress year over year. Mozilla plans to measure and report our greenhouse gas inventory on an annual basis going forward, along with the progress towards reducing our emissions.
Three key findings from our latest GHG data
Key finding 1: The majority of Mozilla’s emissions are in scope 3
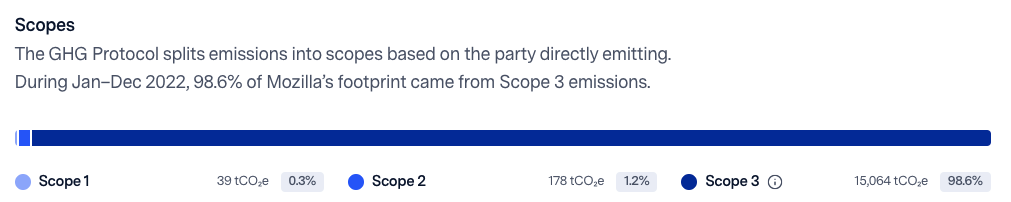
Across the years 2020-2022, >90% of Mozilla’s emissions came from scope 3 categories and for 2022 specifically, this figure was >98%. This is not unusual for an organization in our industry and tells us that Mozilla is facing many of the same challenges as our peers. In the coming years, in addition to mitigating our scope 1 and 2 emissions, we look forward to piloting solutions that address our scope 3 emissions, sharing what we learn and learning from others.
Key finding 2: Our top three emissions categories were purchased goods and services, travel and offices
-

Purchased goods
and services62%
-

Travel
22%

Offices
7%
We also learned that our top emissions categories consisted of purchased goods and services, travel and offices. Collectively, these three categories represented more than 90% of Mozilla’s emissions during the period of 2020-2022. Understanding our emission hotspots provides direction on where we at Mozilla can focus our efforts in order to have the most impact.
Key finding 3: Emissions were impacted by COVID-19
Like many other organizations, the COVID-19 global pandemic impacted Mozilla’s operations, which was reflected in our greenhouse gas emissions, especially between 2020 and mid-2022.
During the past three years, our lowest annual emissions occurred in 2021, at a total of 7,350 tCO2e, in part due to a significant reduction in business travel, employee commutes to the office and Mozilla-hosted in-person events. Additionally, some changes will have a longer-lasting impact. For example, Mozilla has closed or downsized a number of our leased office spaces over the past few years, reducing our real estate portfolio from ten leased offices in 2020 to five leased offices in 2022. With an increased percentage of Mozillians now working fully remotely, we will need to consider how to embed sustainability into the way we work as a globally distributed, remote workforce.
2022 optional product use data summary
Per the Greenhouse Gas Protocol, Mozilla is not required to calculate or report the product use emissions (scope 3, category 11) associated with using our products such as Firefox, Hubs and Pocket. However, Mozilla aims to lead by example and support transparency by reporting this optional data, and we began doing so in 2019. By taking this step, we hope to encourage our peers in the technology industry to do the same.
We first reported this optional product use data in 2019, in partnership with POINT380 and continue this trend for our 2022 data based on a new methodology developed for Mozilla by Watershed. This new methodology more accurately accounts for device emissions that can be reasonably attributed to Mozilla when our products are used, as opposed to over-attributing 100% of device emissions to Mozilla whenever a product is used. Additional details on the methodology can be found in the “Scope and methodology” section of this report.
In 2022, the total emissions from using Mozilla’s products was 533,463 tons of carbon dioxide equivalent (tCO2e).
In 2022, the total emissions from using Mozilla’s products was 533,463 tons of carbon dioxide equivalent (tCO2e)
2019-2022 Greenhouse Gas Inventory Data By the Numbers
Table 1: Total annual emissions by scope
Market-based (in metric tons CO2e)
| 2019 | 2020 | 2021 | 2022 | |
|---|---|---|---|---|
| Scope 1 | 736 | 582 | 53 | 39 |
| Percent of Total GHG Emissions (Scopes 1-3) | 5.2% | 4.3% | 0.7% | 0.3% |
| Scope 2 | 460 | 120 | 382 | 178 |
| Percent of Total GHG Emissions (Scopes 1-3) | 3.2% | 0.9% | 5.2% | 1.2% |
| Scope 3 | 13,026 | 12,903 | 6,914 | 15,064 |
| Percent of Total GHG Emissions (Scopes 1-3) | 91.6% | 94.8% | 94.1% | 98.6% |
| Total | 14,222 | 13,604 | 7,350 | 15,281 |
Notes:
- Totals may not add to 100% due to rounding to one decimal place. Values are rounded and totals are calculated before rounding.
- Scope 1, 2, and 3 emissions are calculated using the Greenhouse Gas Protocol. Mozilla partnered with POINT380 to conduct our 2019 GHG inventory and with Watershed to conduct our 2020-2022 GHG inventories. 2019 figures reported in this table align with data reported in Table 2 of Mozilla's 2019 Greenhouse Gas Inventory Report.
- See the section titled "Scope and methodology" for additional information on methodology.
Table 2: Emissions breakdown by scope
Market-based (in metric tons CO2e)
| 2019 | 2020 | 2021 | 2022 | ||
|---|---|---|---|---|---|
| Scope 1 | Stationary Fuel/Heating | 604 | 558 | 31 | 29 |
| Refrigerants | 132 | 23 | 22 | 10 | |
| Scope 1 total | 736 | 581 | 53 | 39 | |
| Scope 2 | Purchased Electricity: Location-Based (grid average) | 699 | 648 | 448 | 193 |
| Purchased Electricity: Market-Based (incl. renewables) | 460 | 120 | 382 | 178 | |
| Scope 2 total | 460 | 120 | 382 | 178 | |
| Scope 3 | Category 1: Purchased Goods and Services | 9,921 | 7,666 | 5,896 | 8,908 |
| Category 2: Capital Goods | de minimis | 61 | 99 | 126 | |
| Category 3: Fuel and Energy-Related Activities | de minimis | 381 | 177 | 98 | |
| Category 5: Waste Generated in Operations | 109 | 20 | 0 | 5 | |
| Category 6: Business Travel | 2,657 | 3,857 | 44 | 5,099 | |
| Category 7: Employee Commuting | 341 | 862 | 649 | 781 | |
| Category 8: Upstream Leased Assets | not included | 10 | 3 | 6 | |
| Category 11: Product Use | not included | 47 | 45 | 40 | |
| Scope 3 total | 13,028 | 12,904 | 6,913 | 15,063 | |
| Total | 14,222 | 13,604 | 7,350 | 15,281 |
Notes:
- Values are rounded and totals are calculated before rounding.
- Scope 1, 2, and 3 emissions are calculated using the Greenhouse Gas Protocol. Mozilla partnered with POINT380 to conduct our 2019 GHG inventory and with Watershed to conduct our 2020-2022 GHG inventories. 2019 figures reported in this table align with data reported in Table 2 of Mozilla's 2019 Greenhouse Gas Inventory Report. See the section titled "Scope and methodology" for additional information on methodology.
- Scope 3 Category 11 (Use of Products) includes emissions from data transfer. We report additional optional emissions from product use in Table 3.
- See the section titled "Scope and methodology" for additional information on methodology.
Table 3: Optional reporting on Scope 3 Category 11: Product Use emissions
Market-based (in metric tons CO2e)
| 2019 | 2020 | 2021 | 2022 | ||
|---|---|---|---|---|---|
| Total | 785,474 | data not reported | data not reported | 533,463 |
Notes:
- Values are rounded and totals are calculated before rounding.
- Per the Greenhouse Gas Protocol, it is optional to calculate and report indirect use-phase emissions.
- Mozilla worked with different external partners and therefore used different methodologies for our 2019 vs 2022 GHG inventories. Additional information on the approach used by POINT380 in Mozilla's 2019 inventory can be found here. Mozilla worked with Watershed to develop a new methodology for our 2022 inventory. See the section titled "Scope and methodology" for additional information on methodology.
Scope and methodology
For our 2020, 2021 and 2022 greenhouse gas inventories, Mozilla partnered with Watershed to conduct the analysis in accordance with the applicable standards from the Greenhouse Gas Protocol. Watershed offers a third-party software platform that allows us to measure, analyze, and share the results of our greenhouse gas emissions. As a result, our greenhouse gas inventory is comprehensive, including scope 1, scope 2, and relevant scope 3 emissions for Mozilla Foundation, Mozilla Corporation, and subsidiaries such as MZLA.
Watershed periodically updates their greenhouse gas emissions accounting methodology to account for the latest climate science and accounting best practices, which is a continuously evolving space. These updates keep measurements as accurate as possible and in line with the relevancy, completeness, and accuracy principles of the Greenhouse Gas Protocol. Watershed typically applies three different types of methodology updates, in order to 1) incorporate the latest climate science, 2) include all relevant emissions that were previously not considered material, not reported by peers, and/or not quantifiable, and 3) improve granularity and specificity to enable action.
For the optional 2022 product use emissions (scope 3, category 11), Watershed developed a new methodology in partnership with Mozilla to calculate these emissions since a standardized methodology does not yet exist. We used a bottoms-up approach to evaluate the impact of Firefox, Hubs, and Pocket upon electricity consumption. For Firefox mobile, Hubs, and Pocket, input data included total time of active use by device type and country location. For Firefox desktop, input data also included CPU hours by device type and country location and Average Thermal Design Power (TDP) by country location.
This new methodology more accurately accounts for device emissions that can be reasonably attributed to Mozilla when our products are used, as opposed to over-attributing 100% of device emissions to Mozilla whenever a product is used. Since calculating digital and software product emissions is both optional and a newer space with no standard methodology, we aim to continuously improve our approach where possible and will continue to explore opportunities for improvement going forward.
For our 2019 greenhouse gas inventory, Mozilla partnered with POINT380 to conduct the analysis, which was also developed in accordance with the applicable standards from the Greenhouse Gas Protocol. Additional information on the methodology can be found in Mozilla’s report on our 2019 GHG inventory results.