Mozilla Corporation organization representation, 2021 Data
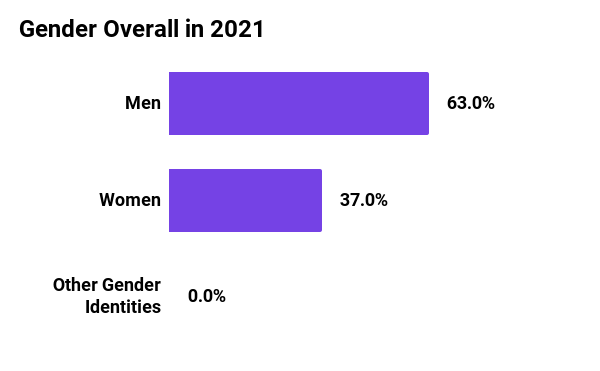
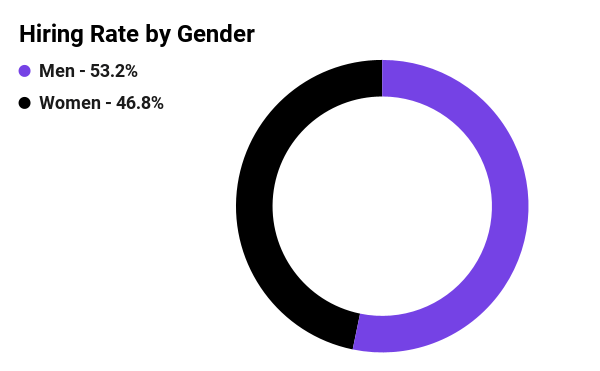
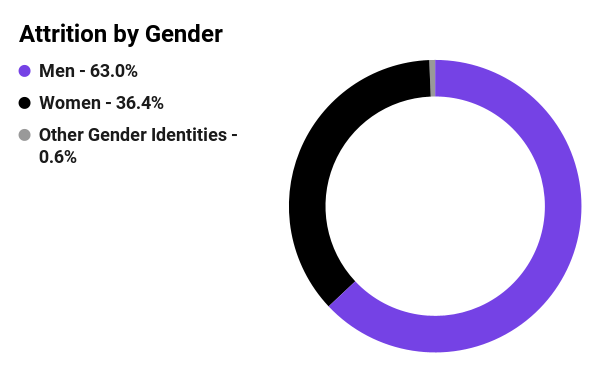
Gender
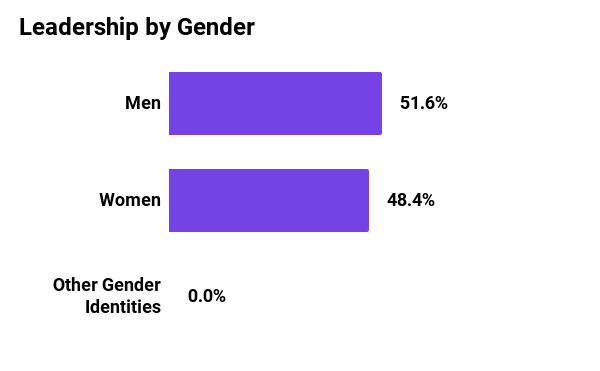
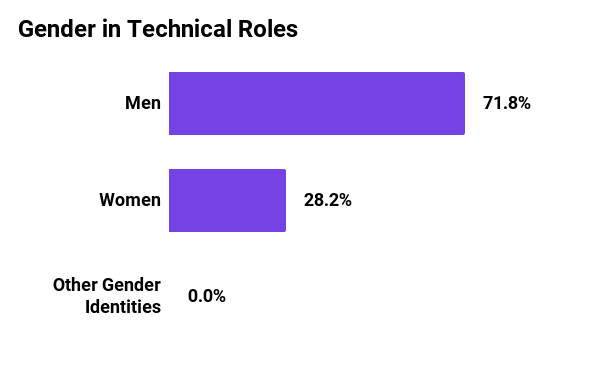
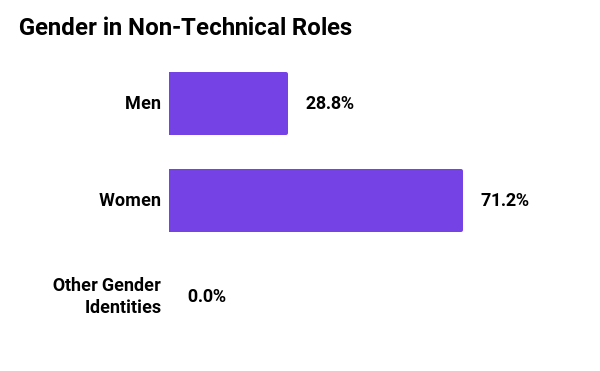
Women make up a little over one-third of the Mozilla Corporation’s workforce, a 3.5 percentage point increase from 2020 to 2021. The hiring rate of women outpaces the rate of departures with women representing 46.8% of hires and 36.4% of departures. We continue to move closer toward achieving gender parity in leadership with women now representing 48.4% of leadership roles, a 2.4% increase since last year. Our continued focus on our recruitment and retention efforts to increase women in technical roles has resulted in a 4.2% increase of women in technical roles from 2020 to 2021.
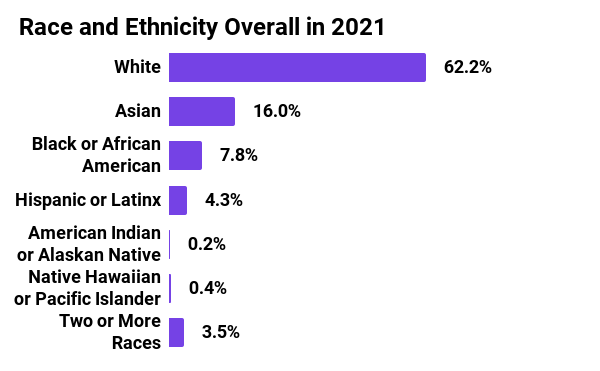
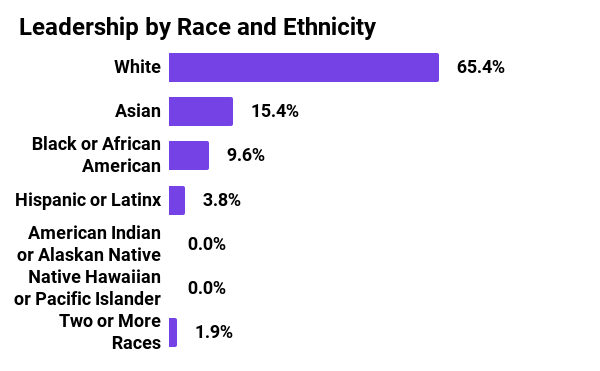
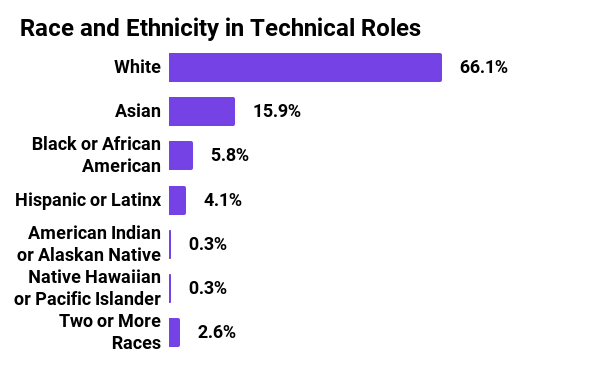
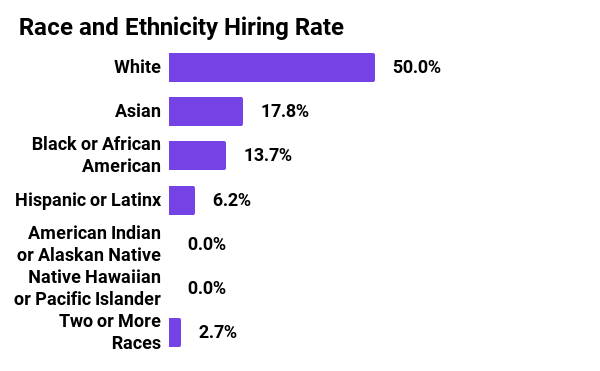
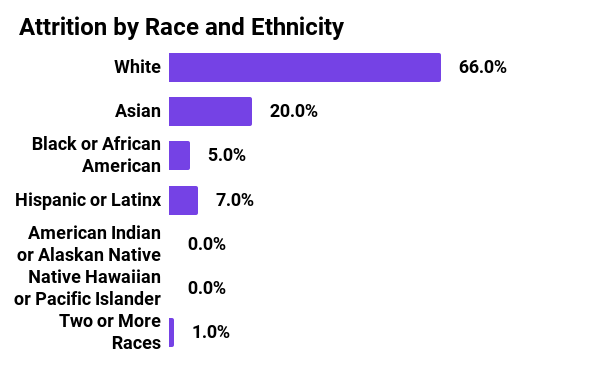
Race and ethnicity (U.S. Only)
In 2021, the percentage of Black/African-American Mozillians increased from 4.8% at the onset of the year to 7.8% by the end of the year. Black/African-Americans in technical roles increased from 3.1% to 5.8% and in leadership roles increased from 9.3% to 9.6%. We did not see the same level of growth in the Hispanic/Latinx employee base. Hispanic/Latinx Mozillians accounted for 4.3% of the US employee base and 4.1% in technical roles which was 4.1% and 3.7% in 2020 respectively. Hispanic/Latinx members of the leadership group rose from 1.9% in 2020 to 3.8% in 2021. While we had good representation in our hiring rate, we saw that we were not able to retain Hispanic/Latinx employees to the extent we would have liked. Similarly for Asian Mozillians, we saw a year-over-year decrease in representation from 16.5% in 2020 to 16% in 2021. Leadership representation dropped from 18.5% to 15.4%. Both of these were mostly driven by the 20% attrition rate.

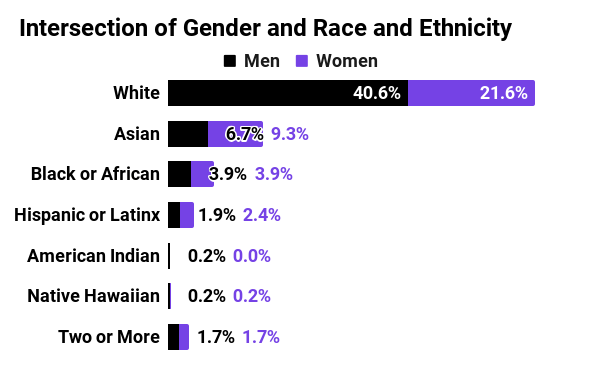
Intersection of gender and race and ethnicity (U.S. Only)
This is our first year sharing the intersection of gender, race, and ethnicity. We are relatively gender-balanced in Black/African-American and Hispanic/Latinx while we have more Asian women than men and fewer White women than men at Mozilla Corporation.
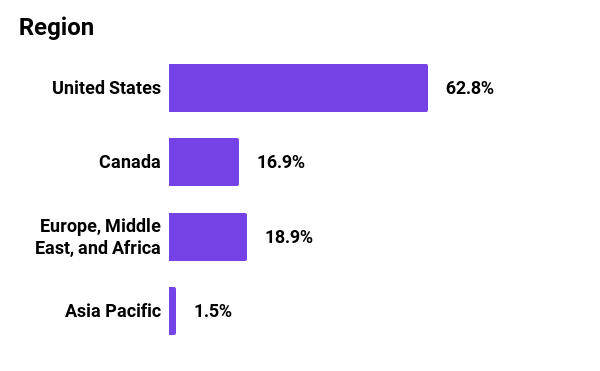
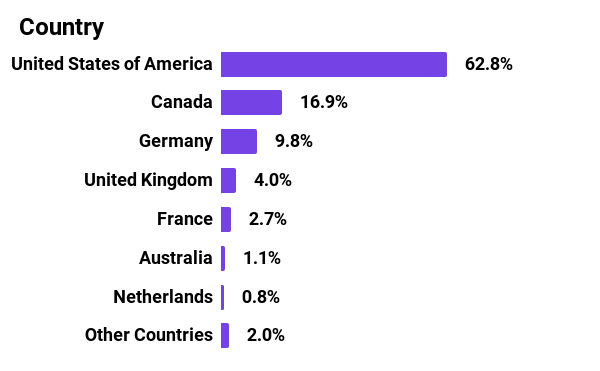
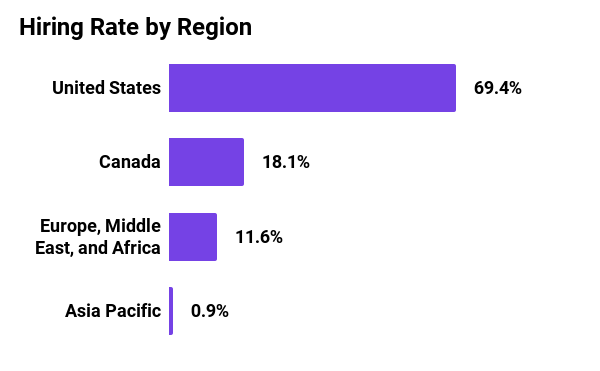
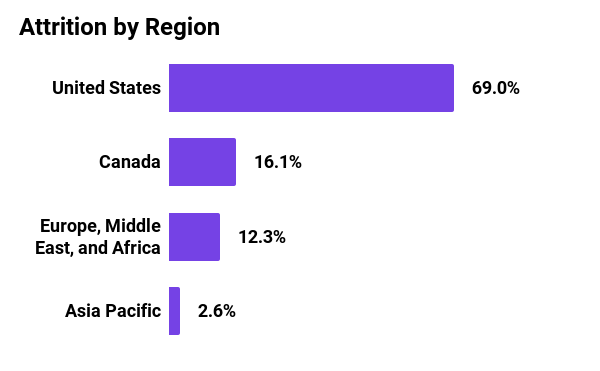
Region and country
The majority of the Mozilla Corporation’s staff is located in the United States with a significant number of employees in Canada and Western Europe. Hiring rates and attrition are roughly equal across regions with hiring slightly above attrition in the US and Canada and hiring slightly lower than attrition in Asia Pacific and Europe, Middle East, and Africa.
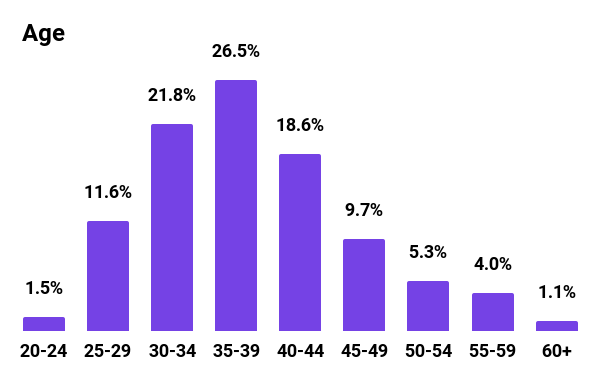
Age
Nearly 39% of staff at the Mozilla Corporation are at or over the age of 40, up one percentage point from the prior year. The median age of our staff at Mozilla Corporation is 37 years old, the same as it was in our previous disclosure.
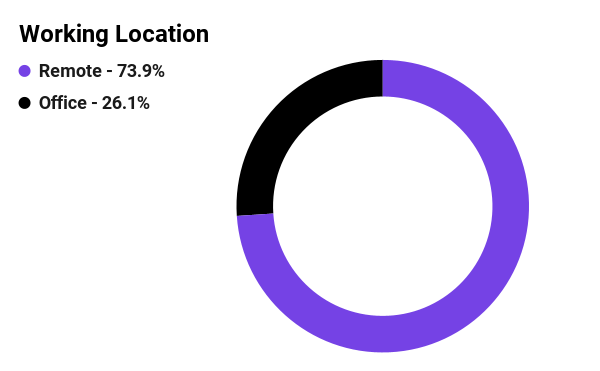
Working location
Mozilla Corporation embraced remote working for many years prior to the pandemic. We currently have almost three quarters of our workforce working remotely, which is up from 54% in 2020.
Methodology
- All diversity data are self-reported and come from the Mozilla Corporation and Foundation’s Human Resources Information System for regular employees as of December 31, 2021. Progress over 12 months is compared against December 31, 2020.
- Staff at the Mozilla Corporation includes only regular, full-time employees. Staff at Mozilla Foundation includes regular, full-time employees and fixed-term employees, as some fixed-term staff are tied to grants or specific funding sources.
- Currently, less than 1% of Mozilla Corporation employees select “other gender identities.” We recognize that gender identities exist on a spectrum.
- In order to be in compliance with global laws, we do not track race and ethnicity outside of the United States at this time. All race and ethnicity data are for employees in the United States only, and categories are driven by United States government requirements for disclosure.
- Leadership representation excludes executive-ranked technical fellows and only includes all levels of directors, vice presidents, and the executive team.
- Technical workers are defined as staff working on our products and within IT.
- Only voluntary departures are included in attrition calculations.
- Employees who decline to provide demographic data are not included in the metrics provided.
- Some categories may not add up to 100% if fields were left blank or listed as “other.”